
About 7,000 people are projected to die in the first week of June.
By Nurith Aizenman & Sean McMinn
NPR (5/13/20)
More than 82,000 people in the U.S. have died of COVID-19 as of Tuesday. How many more lives will be lost? Scientists have built dozens of computational models to answer that question. But the profusion of forecasts poses a challenge: The models use such a wide range of methodologies, formats, and time frames, it’s hard to get even a ballpark sense of what the future has in store.
Enter Nicholas Reich, a biostatistician at University of Massachusetts Amherst. Reich and his colleagues have developed a method to compare and ultimately to merge the diverse models of the disease’s progression into one “ensemble” projection. The resulting forecast is sobering: By June 6, the cumulative death toll in the U.S. will reach 110,000.
Reich’s approach builds on work he’s done over the past four years for the Centers for Disease Control and Prevention, pulling together the many forecasts that U.S. experts create annually to predict how that year’s seasonal influenza will play out.
Reich’s team has set up a similar system to compare coronavirus models. It’s a sort of portal through which the scientists behind each COVID-19 model can communicate key details about their methodology and results, so that, as Reich explains, “all of these forecasts can be represented in a single standardized way. And this makes it really easy to make apples-to-apples comparisons between these models.”
The team unveiled the first version four weeks ago, and ever since they’ve been adding in more forecasts and updating the projections on a weekly basis. The latest update — released Tuesday — incorporates eight models, including some oft-cited ones, such as those built by the Imperial College London, the University of Washington Institute for Health Metrics and Evaluation, Columbia University, and Northeastern University. (They also send each week’s release to the CDC, which publishes a version with a slight time lag.)
The projections vary substantially — with the most pessimistic forecasting a total death toll of 120,000 by June 6, and the most optimistic forecasting 103,000 deaths by that date. But the models have been inching closer to each other. Over the last several weeks, the distance between the highest and lowest estimates has halved from a gap of 36,000 deaths two weeks ago, to a gap of 17,000 deaths in the most recent update released Tuesday.
Still, says Reich, that remains a large difference. Also, he says, some of the models are gyrating fairly significantly from week to week. …
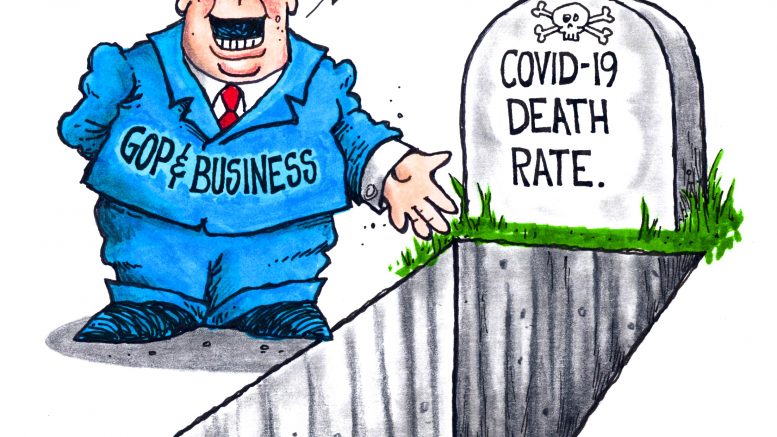
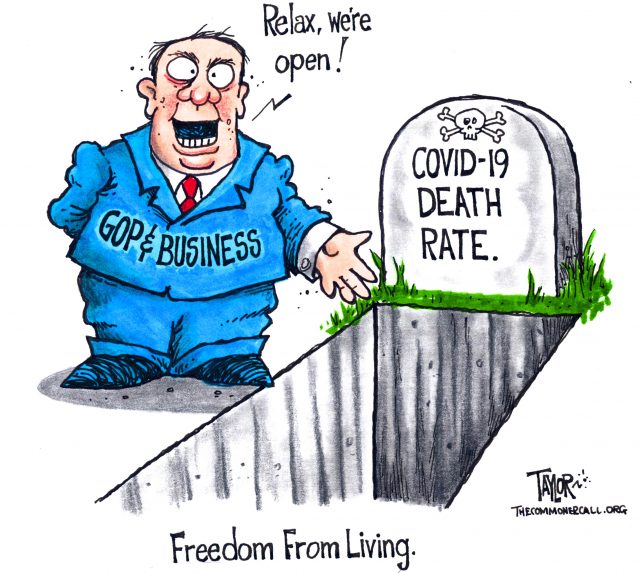
(Commoner Call cartoon by Mark L. Taylor, 200. Open source and free for non-derivative use with link to www.thecommonercall.org )
*****
New US Coronavirus Hotspots Popping Up In Republican Heartlands
By Nina Lakhani
The Guardian (5/13/20)
New coronavirus hotspots are emerging in Republican heartland communities across multiple states, contradicting Donald Trump’s claims that infection rates are declining across the nation.
At a fraught press briefing on Monday, the president declared: “All throughout the country, the numbers are coming down rapidly.”
Yet county-specific figures show a surge in infection rates in towns and rural communities in red states such as Texas, Tennessee, Alabama, Kentucky and North and South Dakota, according to data tracking by the New York Times.
Trump’s claim is also contradicted by data used by the White House’s own pandemic taskforce to track new and emerging hotspots.
In a 7 May report, obtained by NBC News, the list of top 10 surge areas included Nashville, Tennessee; Des Moines, Iowa; Amarillo, Texas; Racine, Wisconsin; Garden City, Kansas, and Central City, Kentucky – a predominantly white town of 6,000 people which saw a 650% week-on-week increase. Muhlenberg county, where Central City is located, has voted Republican in every presidential election since 2004, with Trump winning 72% of votes in 2016 – the biggest ever victory for the party.
The geographical spread of new hotspots suggest that the virus is advancing quickly outside major coastal towns and cities such as New York, Newark and Seattle where infection rates are now plateauing or dipping.
Many of the new emerging hotspots, both rural and urban, are in states where governors refused to issue stay-at-home orders, or are following Trump’s advice to relax lockdown restrictions despite public health warnings about the dangers of doing so too soon.
There are more than 1.3 million cases of coronavirus in the US, including more than 81,000 deaths – by far the highest number in the world. There are only 16 states, plus Puerto Rico and Guam, where the number of new confirmed cases is on the decline.
In Nebraska, while statewide new cases have plateaued but testing remains limited, four counties which have been Republican strongholds for decades are now listed among the country’s worst hotspots. Dakota county, where about 84% of the 20,000 habitants are white, has an infection rate of 7,147 per 100,000 – the second-highest per-capita rate in the US. The governor of Nebraska, where Trump won almost 59% of the vote in 2016, is among eight who never issued statewide stay-at-home orders. …
*****
Coronavirus: Six Lost Weeks When Trump Fumbled & Failed To Contain Covid-19 Outbreak
BBC (5/12/20)
Having watched Asian and European countries struggle against Covid-19, the US was slow to ramp up testing and order its residents to stay at home. We look at this crucial time period and what exactly was done to prevent the outbreak.